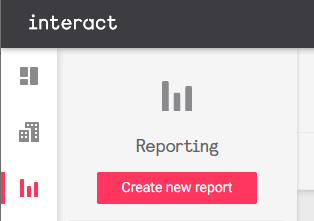
Reporting
The Dashboard includes a variety of reports to view or save for future use:
-
Management: Check-in and occupancy, room status, temperature, humidity, and room alerts
-
Environmental: Temperature, humidity, fan speeds, balcony door use, and environmental averages per floor
-
Occupancy: Daily and hourly averages, and room mode usage over the selected date range.
-
Room Alerts: Daily and hourly system alert trends, system uptime for network gateways, PMS interface, and room devices.
-
Guest Requests: Daily room status trends and average/peak times for room status duration.
-
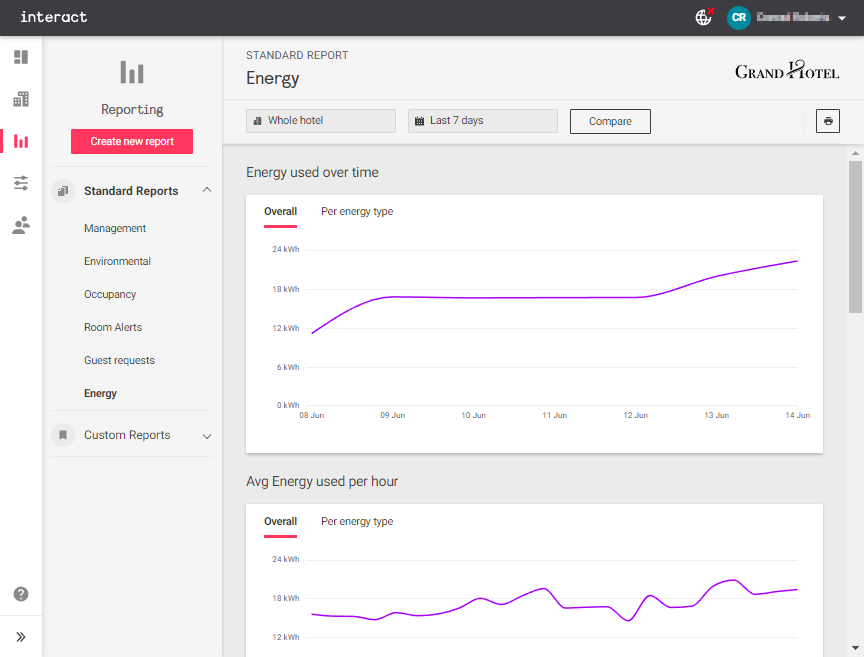
Energy: Notional energy consumption reporting across the entire site, as well as comparisons across services, room profiles, and individual rooms.
|
Energy Reporting
All energy information provided by the Dashboard is notional only, meaning that it is calculated rather than measured or metered. Energy load estimates are entered during the commissioning process and combined with real-time monitoring of room events/activity, occupancy, and environmental conditions to calculate ongoing energy usage for each room. The accuracy of notional energy reporting is dependent on the information provided during commissioning, and may differ from real-world measurements. Where applicable, energy reporting is divided into three types:
|
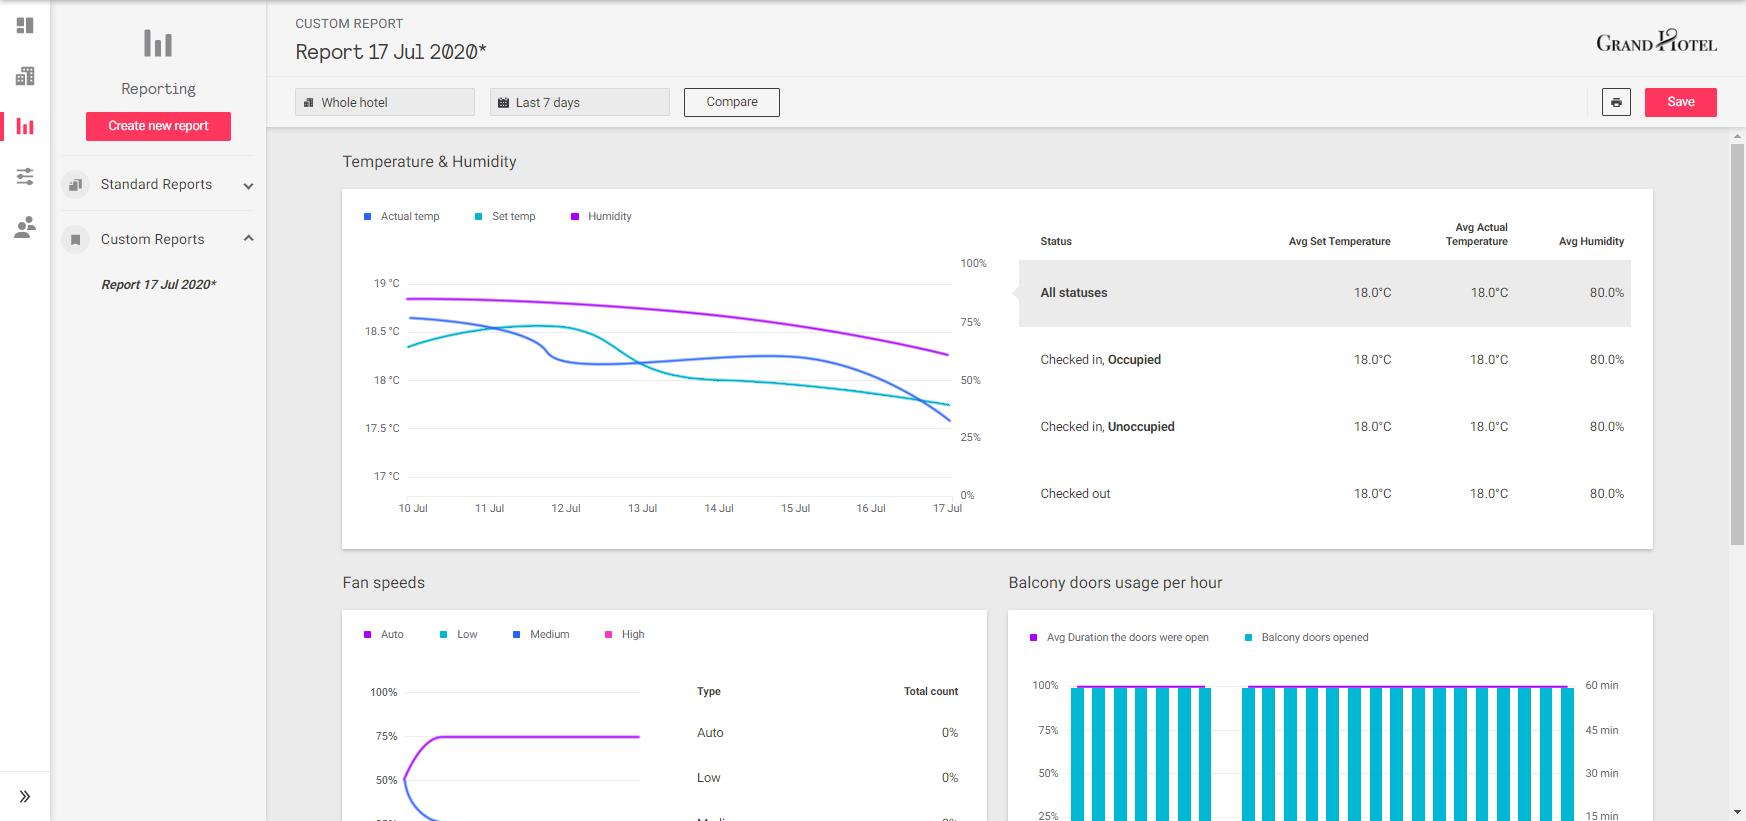
Click the ![]() Print button in the top right corner to print the report to hard copy or PDF for distribution.
Print button in the top right corner to print the report to hard copy or PDF for distribution.
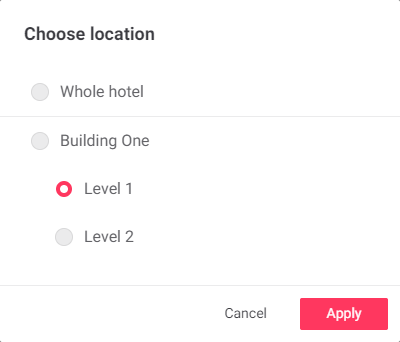
Location
To run a report on a specific building, wing, or level, click on ![]() Whole hotel to open the Choose location dialog box.
Whole hotel to open the Choose location dialog box.
Select the location and click Apply.
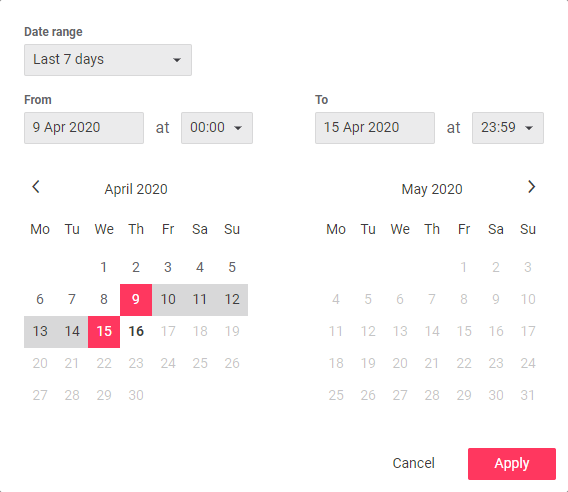
Date Range
Click the ![]() Last 7 days box to open the Date range dialog box.
Last 7 days box to open the Date range dialog box.
Select an option from the Date range dropdown, or specify a custom range on the calendar, and click Apply.
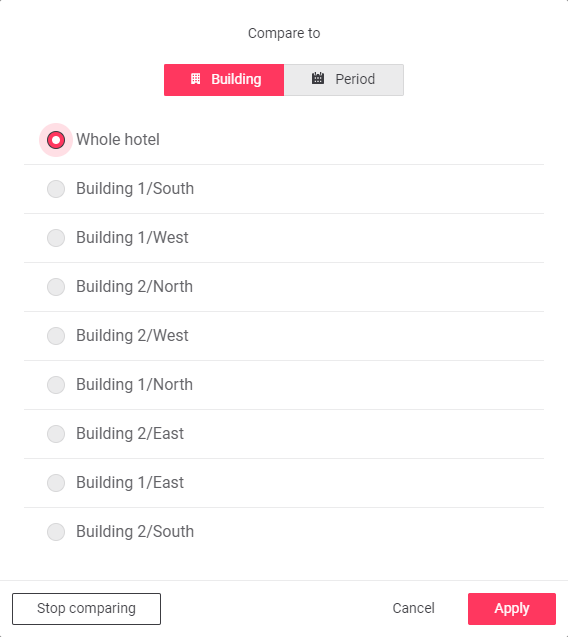
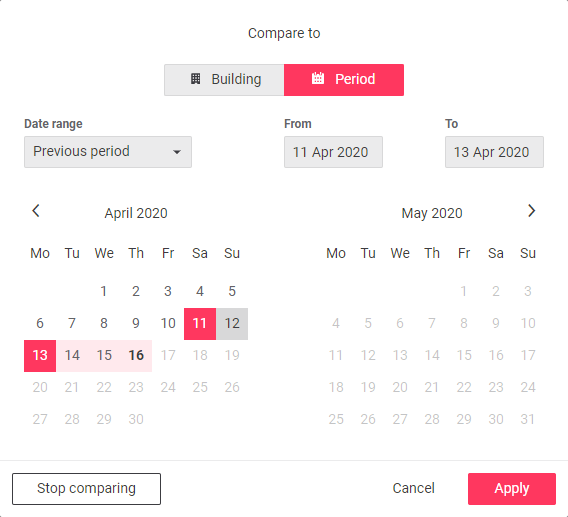
Comparison Reports
Click the Compare button to run a comparison report between two date ranges for the same location, or two locations for the same period.
In the Compare to dialog, select ![]() Building or
Building or ![]() Period, set the parameters for comparison, and click Apply.
Period, set the parameters for comparison, and click Apply.
Comparison reports show a solid line for the original selection and a dotted line for the comparison selection, as below:

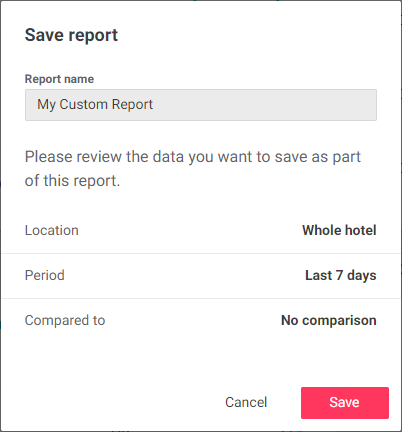
To save the current report or comparison for future access, click Save.
Saved comparison reports are listed under Custom Reports.
Creating Custom Reports
Custom reports enable you to compile and view selected metrics for a chosen date range, across the entire hotel or isolated to a specific location. You can also build custom comparison reports between any two date ranges or locations.
-
Environmental
-
Temperature & humidity
-
Fan speed adjustments
-
Balcony doors usage per hour
-
Environmental data per floor
-
-
Energy
-
Energy used over time
-
Energy used by type
-
The best and worst performing rooms
-
Energy used by room type
-
Average energy used per hour
-
-
Occupancy
-
Checked in & occupancy
-
Average occupancy over selected time
-
Average occupancy per hour
-
Occupancy types
-
-
Alerts and Health
-
Alerts volume over time
-
Alerts volume per hour
-
System uptime
-
-
Room Statuses
-
Room status usage
-
Elapsed times: average and peak
-
-
Click the Create new report button.
-
Select any combination of widgets, then click Continue.
-
If desired, click
 Whole hotel to change the location and
  Last 7 days to change the time period. You can also click the Compare button to set up a comparison report as described in the previous section. Click the Create report button to continue.
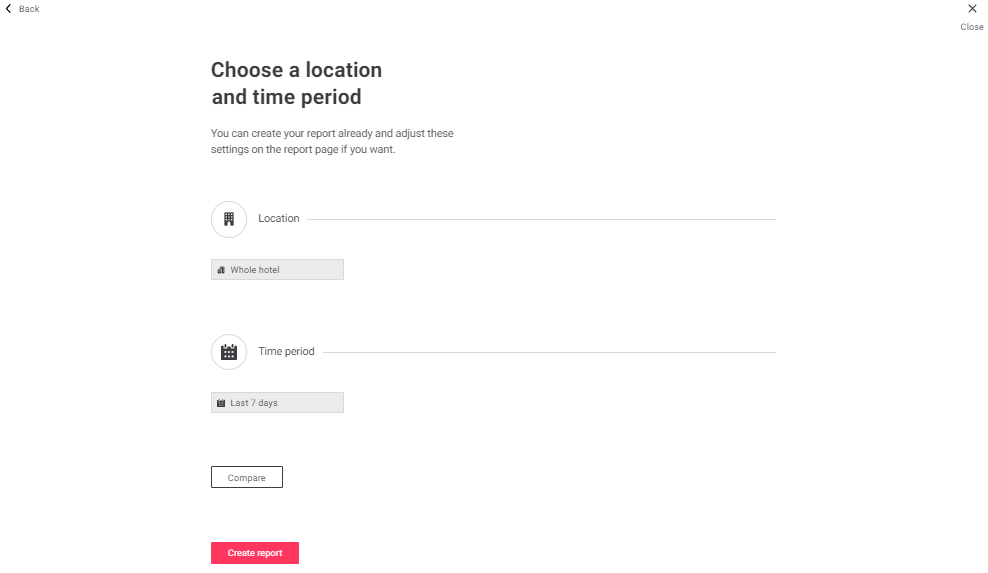
-
Review your new custom report, then click the Save button in the top right corner to open the Save report dialog.
-
Enter a name for the report and click Save again.
-
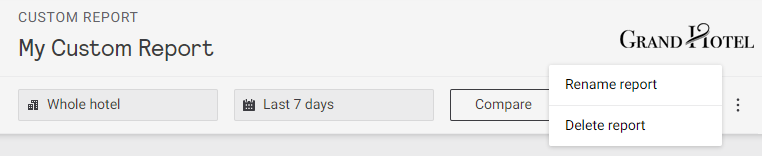
To rename or delete a custom report, click the ⋮ symbol in the top right corner.