Managing Reports
System Manager’s powerful reporting engine generates a range of system performance reports. Predefined templates allow you to easily configure, run, and save customized reports for later use.

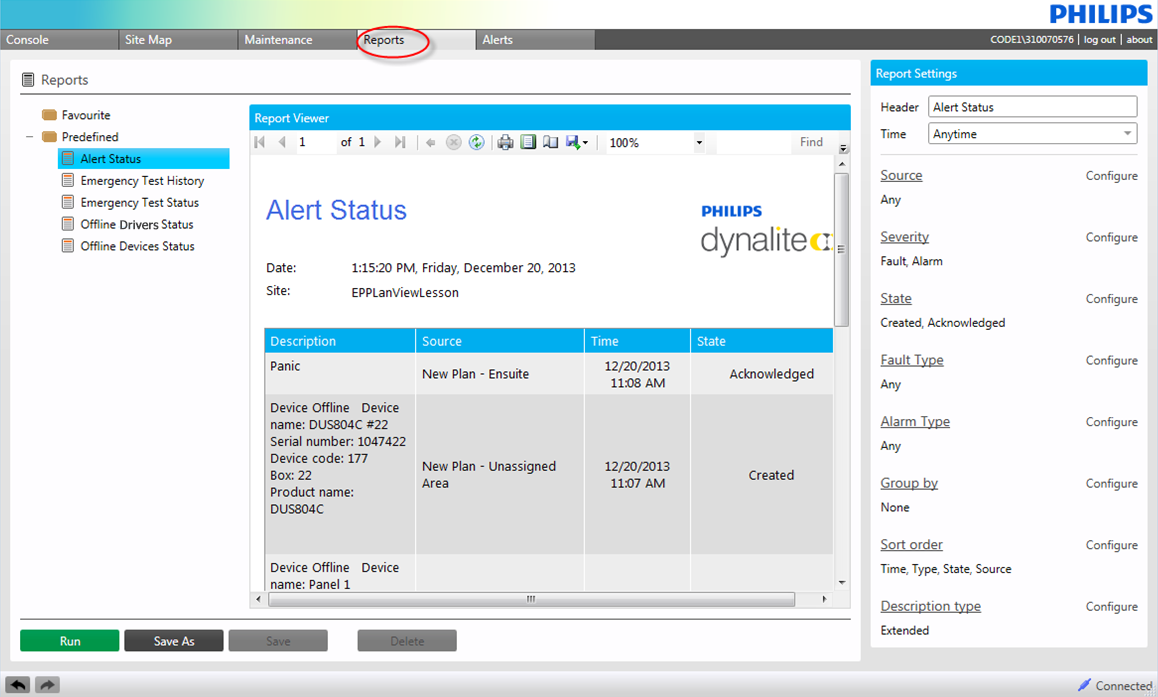
The Reports Tree on the left lists all the predefined and saved favorite reports. Select a report from the tree and click to generate the report.
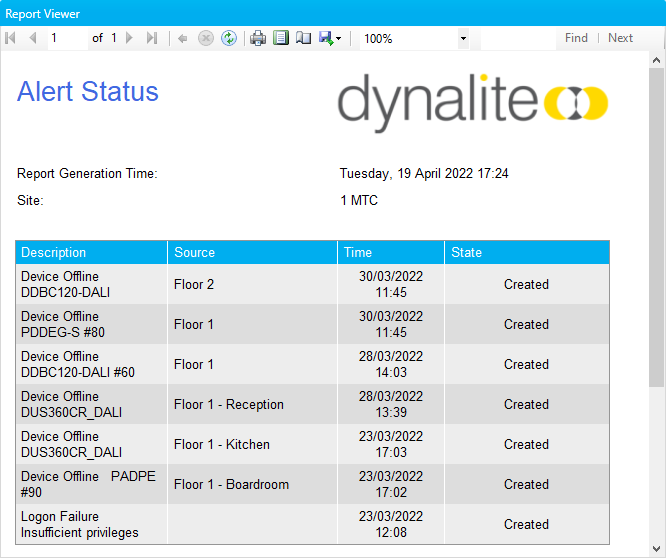
The Report Viewer in the middle displays the generated report content.
The Report Settings on the right shows configurable properties for the selected report template.
|
To replace the report logo with your own (PNG/JPEG), add the filepath to System Manager Configuration > Site Settings > System Settings > Customer settings > Report logo file. The default Philips Dynalite logo filepath is: |
Predefined Reports
| Report | Description |
|---|---|
Alert Status |
Compiled list of all alerts matching the selected criteria |
Channel Runtime |
Runtime, notional energy, and lamp life stats for all lighting channels in the selected plan/area(s) |
Driver Reported Energy |
Compiled list of energy consumption data from all DALI drivers in the selected plan/area(s) that support DALI Part 252 - Energy Reporting |
Driver Status |
Compiled list of DALI driver statuses organized by plan, area, and fixture profile, indicating online/offline drivers and lamp failures. |
Emergency Test History |
Results of previous emergency lighting tests for the selected emergency lighting group(s) |
Emergency Test Status |
The current/most recent results from emergency lighting tests for the selected emergency lighting group(s) |
Energy From Driver Reported Energy |
Total energy consumption from all DALI drivers in the selected plan/area(s) that support DALI Part 252 - Energy Reporting |
Energy From Metered Energy |
Total energy consumption reported by energy meters in the selected plan(s) |
Energy From Metered Power |
Total energy consumption reported by power meters in the selected plan(s) |
Metered Value |
Compiled list of all available data from energy/power meters in the selected plan(s) |
Notional Energy |
Calculated energy consumption estimate for the selected plan/area(s), based on device and lamp specifications |
Notional Energy Savings |
Calculated estimate of energy saved by dimming/turning off lights in the selected plan/area(s), based on device and lamp specifications |
Notional Power |
Calculated power consumption estimate for the selected plan/area(s), based on device and lamp specifications |
Notional Power Savings |
Calculated estimate of power saved by dimming/turning off lights in the selected plan/area(s), based on device and lamp specifications |
Occupancy Status |
Occupancy history for the selected plan/area(s) |
Offline Drivers Status |
Compiled list of Driver Offline fault alerts |
Offline Devices Status |
Compiled list of Device Offline fault alerts |
Percentage Occupancy |
Percentage of occupied Intervals for the selected plan/area(s) over the specified Time period |
Schedule |
List of all configured schedules |
Sensor Lux Level |
Reported light levels for the selected plan/area(s) |
User Action Events |
Timestamped record of user inputs, including preset scene and temperature setpoint commands |
Favorite reports
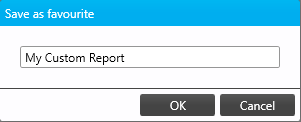
After modifying the settings of a predefined report, you can save it to your favorites for future use. Click , enter a name, and click .
You can also a favorite report, modify it and your changes, or modify and a new favorite without altering the original.

Report Settings
Each report can be customized by configuring one or more of the properties below. Only the properties relevant to the report type are shown.
Click Configure next to the desired property to adjust it.
| Property | Description |
|---|---|
Header |
The title displayed at the top of the report. |
Time |
The time period covered by the report:
|
Source |
Filter data by plan/area, emergency group, user event type, or fault type, depending on the report. |
Source Type |
Toggle the Source between Plan or Area. |
Fixture Profile |
Filter by fixture or lamp type. |
Status |
Filter by Driver Online/Offline |
Failure Reason |
Filter by Driver Offline or Lamp Failure |
Interval |
Adjust the time period increment for Percentage Occupancy reports. |
Severity |
Filter by alert type(s). |
State |
Filter by the state(s) of faults or alarms. |
Fault Type |
Filter by fault type(s). |
Alarm Type |
Filter by alarm type(s). |
Event Type |
Filter by event type(s). |
Test Type |
Filter by emergency test type(s). |
Result |
Filter by emergency test result type(s). |
Include Previous Results |
Add the previous One or Two emergency test results to the report for comparison. |
Group By |
Arrange output into various grouping options depending on the report type. |
Sort order |
Determine the order in which the output is sorted. You can click and drag individual criteria up and down, or select an item and use the and buttons. |
Description Type |
Toggle the level of detail presented in the description field between Simple or Extended. |
Report Viewer
The viewer displays the most recently generated report.

Use the toolbar at the top of the viewer to:
-
Switch between pages
-
Refresh the report
-
Print the report
-
Preview the Print Layout
-
Adjust the Page Setup for printing
-
Export to Excel, PDF, or Word format
-
Adjust the Zoom level
-
Search for specific terms using the Find Text in Report textbox