Monitor System
The System Manager Monitor window lets you see what’s happening by showing you all system activity and communication between System Manager, System Builder, and DyNet.
Application Logging
The application log records a message for all actions undertaken by SM with an ID sequence number and the message type, date, and time.
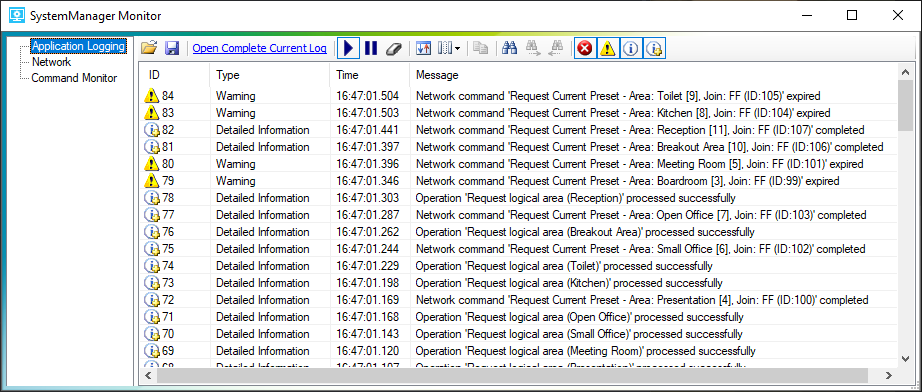
The application log toolbar includes the following commands:
-
 Open Existing Log File - Opens a previously saved daily log file.
 -
 Save current Log Entries - Saves a backup copy of the current log file.
 -
Open Complete Current Log - Opens a new page in the monitor window showing all log files for that day. When the log file’s maximum limit is reached a new log file is created for that day.
-
 Start Logging - Updates the application log in real time.
 -
 Pause Logging - Freezes the application log display.
 -
 Clear Log Entries - Clears the Application log display. Entries are still available in the saved log file.
 -
 Ascending/Descending Order - Sorts messages in ascending/descending order according to the ID number.
 -
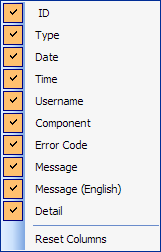
 Show/Hide Columns - Allows you to select the columns from the available list:
-
 Copy Selected Log Entries - Copies the entire log entry to the clipboard.
 -
 Find - Finds the specified text in the log file entries.
 -
 Find Next - Find the next log entry matching the specified text.
 -
 Find Previous - Find the previous log entry matching the specified text.
 -
Message type filtering - Filter by the following message types:
-
 Show Log Errors
 -
 Show Log Warnings
 -
 Show Log Information
 -
 Show Log Detailed Information
-
Network
The network log is the most commonly used monitor window. The network log records messages (hexadecimal data) travelling on the network. It shows messages sent by SM as well as other applications and devices on the system. A description of the message is provided as well as the message direction.
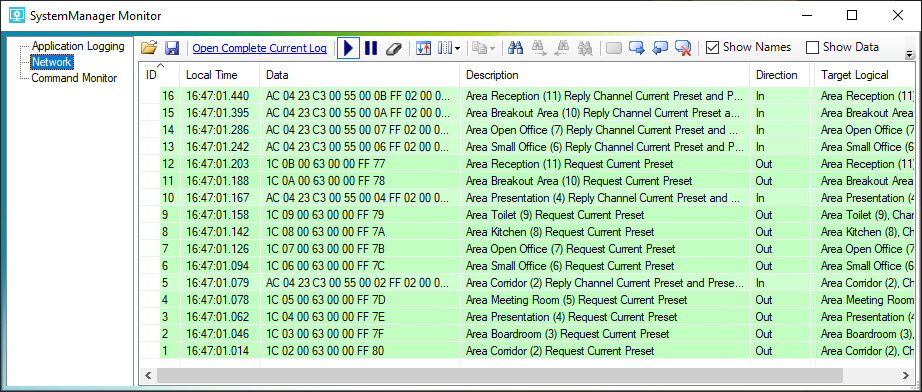
The network log toolbar includes the following commands:
-
 Open - Open a previously saved daily log file.
 -
 Save - Save a backup copy of the current log file.
 -
Open Complete Current Log - Open a new page in the monitor window showing all log files for that hour. When the log file’s maximum limit is reached a new log file is created for that hour.
-
 Start Logging - Update the application log in real time.
 -
 Pause Logging - Freeze the application log display.
 -
 Clear Log Entries - Clear the Application log display. Entries are still available in the saved log file.
 -
 Ascending/Descending Order - Sort messages in ascending/descending order according to the ID number.
 -
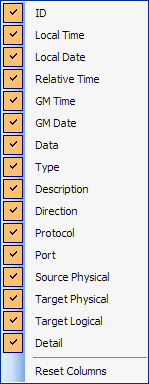
 Show/Hide Columns - Allows you to select the columns from the available list.
-
 Copy Packet - Copy the selected packet or log entry line(s) to the clipboard.
 -
 Find - Finds the specified text in the log file entries.
 -
 Find Next - Find the next log entry matching the specified text.
 -
 Find Previous - Find the previous log entry matching the specified text.
 -
 Clear Find All - Remove the highlight from entries found with the find all function.
 -
 Toggle Bookmark - Add and Remove bookmark on selected line. Bookmarked entries are shown in bold. Bookmarks are saved in all logs.
 -
 Next Bookmark - Find the Next bookmark.
 -
 Previous Bookmark - Find the previous bookmark.
 -
 Delete All Bookmarks - Remove all bookmarks from the current Network log.
 -
 Show Names - For devices it displays the name given in the target logical column. For Areas, Channels and Presets it displays the name given in both the description and the target logical columns. It also displays device names for physical messages.
 -
 Show Data - Toggle the Data pane, which displays the hex string for the selected message.
 -
 Show Details - Toggle the Details pane, which displays a description of the selected message.
-
 Scroll Details - Updates the Details and Data windows to the newest message in the network log. Only available when Show Details is active.
-
-
 Show Statistics - Toggle the Statistics pane, which displays total and average network activity as well as a graph of the most recent five minutes.
Network Log Colors
The color of each network log entry indicates the following conditions:
| Color | Meaning |
|---|---|
|
Find all highlight |
|
Bad packet |
|
Program preset |
|
Logical message |
|
Device application sign-on |
|
Bootloader sign-on |
|
Device reset |
|
Bootloader reboot |
|
Device load and save |
|
File transfer |
|
All other physical messages |
Command Monitor
The command monitor shows the status of application messages sent to the network, and provides a higher level summary of commands sent from SM.
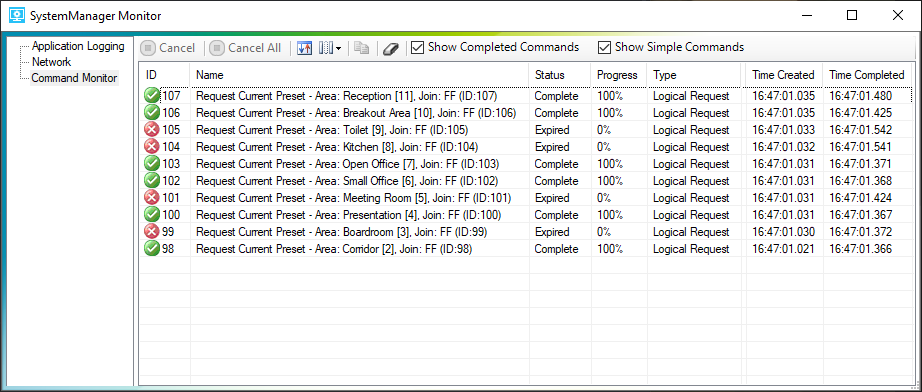
The command monitor toolbar includes the following:
-
 Cancel Selected Command Cancels the current command selected in the command monitor.
 -
 Cancel All Command Cancel all running and currently queued commands.
 -
 Ascending/Descending Order Sorts messages in ascending/descending order according to the ID number.
 -
 Show/Hide Columns Allows you to select the columns from the available list.
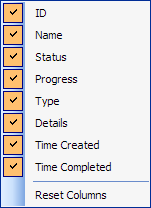
-
 Copy Selected Log Entries Copies the entire log entry to the clipboard.
 -
 Clear Completed Commands Clears all commands from the Command Monitor window.
 -
 Show Completed Commands
If ticked completed commands are displayed in the list.
If unticked, completed commands are not displayed. -
 Show simple Commands
If ticked simple messages are displayed in the list.
If unticked, simple commands are not displayed.
Commands will be in one of the following states:
-
 Command Queued
 -
 Command Delayed
 -
 Command Active
 -
 Command Active Delayed
 -
 Command Complete
 -
 Command Expired
 -
 Command Cancelled
 -
 Command Superseded
 -
 Command Failed
DyNet commands are categorized into the following command types:
-
Physical Command
-
Physical Request
-
Logical Command
-
Logical Request
-
Device Load
-
Device Save
-
Device Attributes
-
Device Change Box Number
-
Device Firmware
-
Device Discovery